Plotting the Bitcoin Feerate Distribution
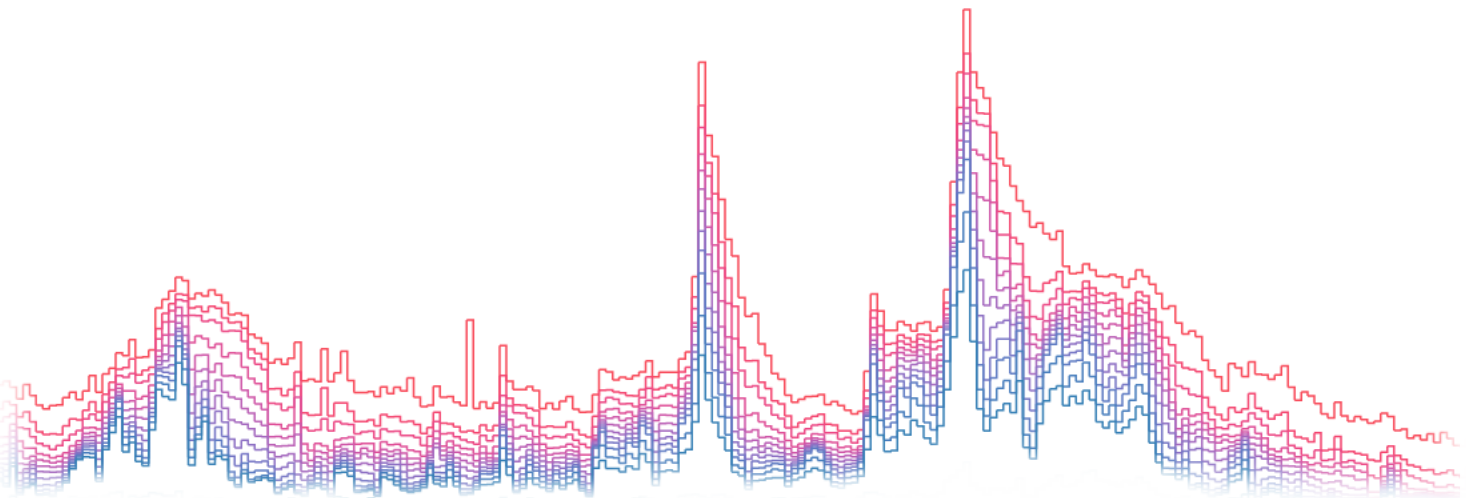
Sunday, March 18, 2018How did the median Bitcoin feerate evolve from 2013 to 2015? When were the feerate spikes in 2017? Visualizing the Bitcoin feerate distribution per block was on my todo list since I’ve started working on the first version of my mempool.observer project in mid-2017. But acquiring the data wasn’t as easy as I first thought.
Update January 2020: The feerate chart have are not included the 2020 version of transactionfee.info so some links in this post might be broken.
In this post, I describe my unsuccessful approaches and explain my final solution. I’ll go into beginner to intermediate technical stuff on Bitcoin. I hope this post might help people who are just starting out on small Bitcoin projects (i.e. me a few months ago).
Motivation
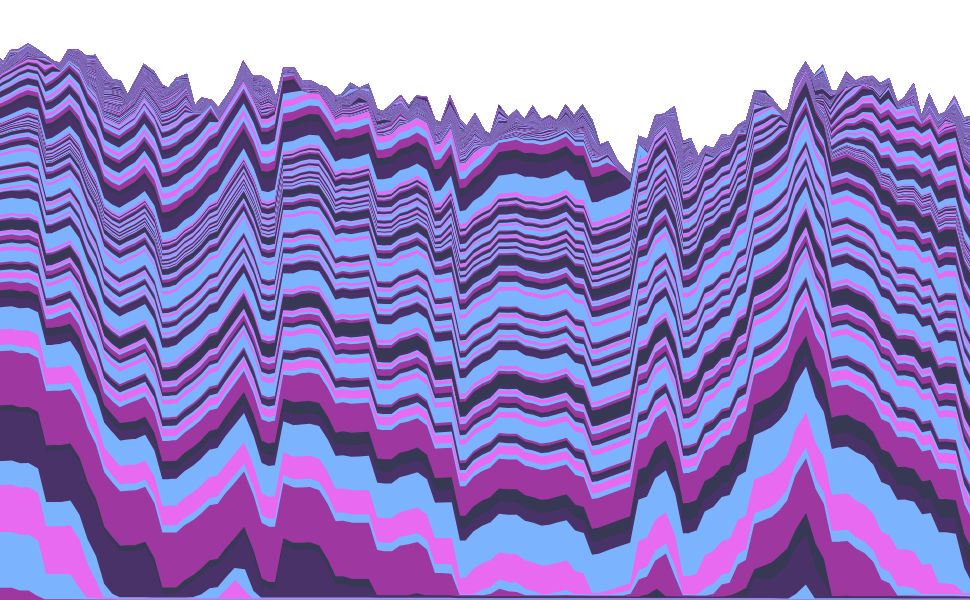
Our site transactionfee.info lets a user check the fee efficiency of a bitcoin transaction they’ve send or received. Besides SegWit and output batching we wanted to provide an indicator when a service drastically overpays the feerate. We needed data on the feerate distribution per block to determine what a low, but reasonable feerate would have been to be included in the same block. David Harding suggested plotting the feerate across ten-percentile intervals to see which percentile is suitable.
Querying feerate data over the RPC interface
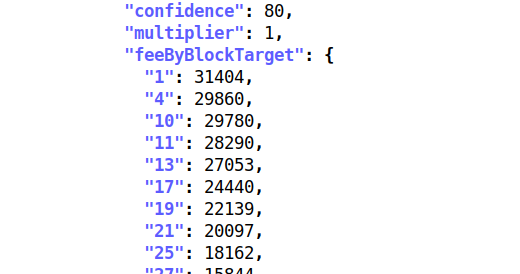
My first idea was to query each block over the Bitcoin Core RPC interface. The query getblock blockhash 2 returns the corresponding block with all its transactions as JSON. For the feerate distribution per block, I’d need to iterate over each transaction and calculate its feerate. The feerate is specified as the transaction fee divided by the transaction vsize $$(2)$$. The fee is the sum of all input amounts deducted by the sum of all output amounts $$(1)$$.
fee = sum(input amounts) - sum(output amounts)feerate = fee / vsize
However, querying each block with its transactions is not enough. An input only references a previous transaction output (TXO). It doesn’t contain the actual input amount. This can be solved by simply querying the TXO. RPC-call batching brings huge performance improvements here.
I coded a small python script and used a local testnet node to generate a first data set.
Everything worked fine and I quickly had a basic chart setup to share my initial proof of concept.
However, I didn’t think about the testnet versus mainnet performance of that script.
Since blocks on mainnet contain more transactions and more inputs per transaction the script ran ages querying data from my HDD.
I eventually stopped it and started looking for alternative approaches.
Alternatives
Reading the raw .dat files
I looked at multiple blk*.dat-file parsers to build a TXO-index for quicker lookups. This turned out to be a dead end. I wanted to automatically update the data every few hours on a small VPS, but the output of the index would probably have been more than a hundred gigabytes. This was not an option for me.
Google’s BigQuery Bitcoin Blockchain data set
When I stumbled over Google’s BigQuery Bitcoin Blockchain data set I thought this would solve all my data problems, but was quickly disappointed with the limited data that’s available. I miss the reference to the TXO in the input table. The data set might be well suited for other projects and one plus point definitely is the ten-minute update interval, but I, at least for this project, have no use for it.
BlockSci
Then I found out about BlockSci: “A high-performance tool for blockchain science and exploration”.
It seems to do exactly what I wanted to do. At the time I looked into it, it didn’t use the vsize for feerate calculation.
This would have resulted in an incorrect feerate for SegWit transactions.
However, a few days ago v0.4.0 was released which uses the vsize for feerate calculations.
If you are interested in working with data from the bitcoin blockchain I can highly recommend taking a look at their paper.
Patching Bitcoin Core and -reindexing
As a final solution, I included a simple LogPrintf in validation.cpp of Bitcoin Core.
I print an identifier to grep for followed by the block height and the feerate for each non-coinbase transaction into the debug.log separated by a comma.
The patch diff is only a few lines.
After compiling and a full -reindex of the blockchain my debug.log contained all blocks with the feerate of each transaction.
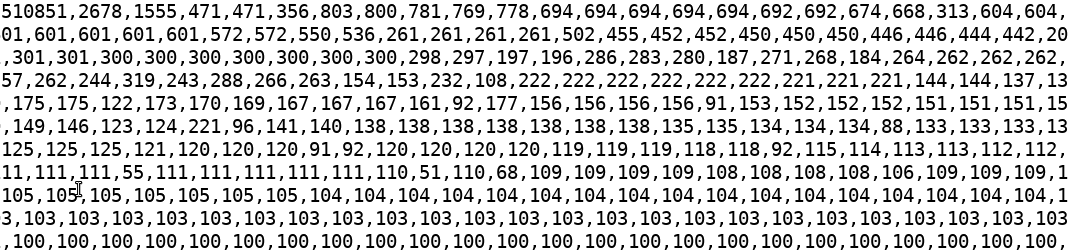
Grepping the blocks from the debug.log leaves me with about a gigabyte of raw data (around 100MB gziped).
Using the dataset
I have a pruned node running on a small VPS and insert the percentile data into a database. I then automatically generate the .csv-files which are displayed on transactionfee.info/charts. In my next step, I’ll connect the database to an indicator on transactionfee.info.
I guess I’ll be using the raw data to experiment a bit with Gnuplot in the future. I have a neat idea for that. And retrospectively rating feerate estimation algorithms might be an idea, too. Feel free to contact me if you are interested in the data set.
My open-source work is currently funded by an OpenSats LTS grant. You can learn more about my funding and how to support my work on my funding page.
 Text and images on this page are licensed under the Creative Commons Attribution-ShareAlike 4.0 International License