peer-observer: A tool and infrastructure for monitoring the Bitcoin P2P network for attacks and anomalies
Tuesday, July 29, 2025Over the past few years, I’ve been working on monitoring tools for the Bitcoin network. One of these projects is peer-observer: A tool and infrastructure for monitoring the Bitcoin P2P network for attacks and anomalies. This post describes the motivation for starting yet another Bitcoin network observer. It details how the tool works, what my honeypot infrastructure looks like, and finishes with an idea for a decentralized Bitcoin Network Operations Collective and incident response team.
Motivation
At some point in late 2021, I stumbled across reports of an addr message flooding having happened a few months earlier on the Bitcoin network. It was first reported by Piotr Narewski, the maintainer of the Gocoin Bitcoin node implementation, in a thread called Loads of fake peers advertised on bitcoin network. Piotr details that his node was receiving “hundreds of thousands of non-working [IP] addresses” via the addr P2P message in July 2021. Since his node implementation stores all addresses1, he is experiencing high resource usage and needs more connection attempts until a working peer is found.
Matthias Grundmann and Max Baumstark from the Karlsruhe Institute of Technology noticed this attack on their DSN Bitcoin Monitoring infrastructure, too. In a preprint for a paper, they write: “Some peers in the Bitcoin P2P network distributed a huge amount of spam IP addresses during July 2021. These spam IP addresses did not belong to actual Bitcoin peers.”.
At the same time, the Bitcoin Core PR #22387: Rate limit the processing of rumoured addresses, is being tested and reviewed. This PR implements rate-limiting for the number of addresses a peer can send to a node. Previously, Bitcoin Core would “happily accept and process an effectively unbounded rate from attackers”. During testing of this PR, reviewers note that the rate-limiting is being triggered by peers on mainnet. This is likely related to the same addr-flodding attack observed by Piotr, Matthias, and Max.
Three years later, the Bitcoin Core project discloses CVE-2024-52919 - Remote crash due to addr message spam discovered by Eugene Siegel. An attacker could remotely crash Bitcoin Core nodes by spamming addr messages that would then be inserted into the addrman. The node would crash due to a 32-bit identifier overflowing. This was fixed by the rate limiting implemented in PR #22387 and then later changing the 32-bit identifier to a 64-bit identifier.2
Learning about this attack a few months after it happened, I started to wonder what other attacks are happening on the Bitcoin P2P network. While the addr-flodding attack was detected by a few different parties, I had the feeling that it would be good to not only learn about these attacks by coincidence. The idea for another Bitcoin network monitoring tool was born.
The peer-observer tool
Early on, I decided that my monitoring should be passive and as minimally invasive to the Bitcoin network as possible. This means, for example, not to use up inbound connection slots by connecting to all possible Bitcoin nodes on the network. I decided to run multiple honeypot nodes that are normal, honest nodes that behave well and participate in block and transaction relay. They just have a lot of monitoring tools attached to them.
Since Bitcoin Core is currently the most widely used node software on the Bitcoin network, I choose to focus on it for now3. This allows for testing out various Bitcoin Core node features and configuration options that could be susceptible to attacks or anomalies (i.e., bugs).
Interfaces
To extract data and events about the P2P network and the peers connected to a Bitcoin Core node, interfaces are needed. To learn about events in real-time via machine-to-machine interface, I started implementing peer-observer primarily with the Bitcoin Core tracepoint interface I’ve been working on over the past few years. The tracepoint interface provides all data required for an MVP. As alternatives, I also considered parsing the Bitcoin Core debug.log similar to James O’Beirne’s bmon tool and fetching data from the RPC interface. The debug log is primarily an interface for humans and not machines. Parsing log messages that might change without warning over time didn’t seem optimal to me. Polling on the RPC interface doesn’t give me the required resolution. For example, between two calls to getpeerinfo, multiple peers might have connected and already disconnected.
Nonetheless, I’ve started exploring adding support for extracting data from more interfaces. The RPC interface, and particularly, getpeerinfo, can be useful to get more stateful information about peers. Since the tracepoint interface has a few pain points, I’ve also started thinking about an IPC-based alternative. In the future, it might become worthwhile to supplement the data with parsed debug.log output, while keeping in mind that the log statements might change over time.
For peer-observer, I primarily use the net tracepoints to learn about in- and outbound P2P messages and opened, closed, evicted, or misbehaving connections. The validation:block_connected tracepoint, along with mempool tracepoints, are also interesting to get insights into block processing and the node’s mempool. For a while, I’ve also maintained custom tracepoints in a patch, for example, addrman tracepoints, to see how much effect peers can have on our addrman.
Extractors and Tools
To be able to process data from multiple Bitcoin Core interfaces in multiple tools, I choose a message queue that allows for multiple publishers and consumers. Extractors, like the ebpf-extractor, hooking into the tracepoint interface, publish events into the message queue. On the other end, subscribers or Tools consume these events and further process them. The most basic tool, called logger, just logs all received events. As a message queue peer-observer is using a NATS.io server. Messages are serialized using protobuf.
                                                ┌──────────────────────┐
                                      NATS.io   │ Tools                │
                                      PUB-SUB   │                      │
                                         ┌──────┼──► logger            │
              Tracepoints                │      │                      │
┌───────────┐ via libbpf                 ├──────┼──► metrics           │
│  Bitcoin  │       ┌───────────────┐    │      │                      │
│ Core Node ├───────► ebpf-extractor├────┼──────┼──► websocket         │
└───────────┘       └───────────────┘    │      │                      │
                                         ├──────┼──► addr-connectivty  │
                                         │      │                      │
                                         └──────┼──►...                │
                                      protobuf  │                      │
                                      messages  └──────────────────────┘
logger tool
The logger tool logs events to stdout and supports basic topic filtering (thanks to Nasser for PR #138). I mainly use it to show how much communication is happening between a Bitcoin Core node and its peers.
The output of the tool looks similar to the following snippet. Here, <- and -> indicate an in- and outbound P2P message to or from our node. Connection events are marked with # CONN.
--> to id=11937171 (conn_type=1): wtxidrelay
 --> to id=11937171 (conn_type=1): sendaddrv2
 --> to id=11937171 (conn_type=1): verack
 <-- from id=10237648 (conn_type=1): Inv([WTx(205bfe2dfbeb46c7d91963a13097ef49511ad2d71c3018fdbdebbff83d8caa2f), WTx(0cd27eb1f63d95c0ec82adf0090756aef0eb1b1e840634ec7a4f440919ab991c), WTx(98bb7eb29ab06dcfdd30aa4875ebafcedd14da2738d63d0cc8d6dcc0f3a12e8b), WTx(a361125873bffb5d70636e50bac18bd71963821d05ba07d9d70c91e660779632)])
 <-- from id=10752006 (conn_type=1): AddrV2([Address(timestamp=1750941674, address=IPv4(XXX), port=8333, services=3077), Address(timestamp=1750941953, address=IPv4(XXX), port=8333, services=3081), Address(timestamp=1750941813, address=IPv6(XXX), port=8333, services=1032)])
 <-- from id=10162242 (conn_type=1): Inv([WTx(5a7a949a920cf57eacd8ad38906a56ba6882188dda4ff9ea5660aad35adf1ef4), WTx(1acc1f2f3ec70c4ffd2181783bb2407e204be39b1017b5ae13d45b9b54a19e43), WTx(5a68c9197c31b5629c146be6d789a44bbb03e2c43633216ec0ca8cd73bd737f2), WTx(78ad4525de5b0e03db2b552b0091275caf781d57b04affc468d960ba645c1370)])
 # CONN EvictedInboundConnection(conn=Connection(id=11937171, addr=<linkinglion>, conn_type=1, network=2), time_established=1750942328)
 # CONN InboundConnection(conn=Connection(id=11937172, addr=<linkinglion>, conn_type=1, network=1), existing_connections=115)
 # CONN ClosedConnection(conn=Connection(id=11937171, addr=<linkinglion>, conn_type=1, network=2), time_established=1750942328)
 <-- from id=11554724 (conn_type=1): Inv([WTx(12eff03d987ef34ec759abe864bd88c2ecb4c994bd23ac18680fed251440020a), WTx(1e34d5e8d3e34ee7257363a34c877ea6031f0657574c78d6d1379485e1a8b533), WTx(68ae6c3279f1797f08f90948d7599ec60a476f896013f164a49b38eae10c6cf9), WTx(d1d6a9a50d1059db07a8367e52a6569d989f2dcdde24e56369aae2aaab4cf0aa), WTx(8c3c1033296b4c593560f40fd22929cbcc6f63c3ec20287829e9b52dea9a4ea2), WTx(77c7e46e402f94c4a03445479e727b67008e105f2c97d3120e8c2d2008b6c6c3)])
 <-- from id=11875990 (conn_type=1): Pong(16368378148765531861)
 <-- from id=8950578 (conn_type=1): Inv([WTx(12eff03d987ef34ec759abe864bd88c2ecb4c994bd23ac18680fed251440020a), WTx(1e34d5e8d3e34ee7257363a34c877ea6031f0657574c78d6d1379485e1a8b533), WTx(68ae6c3279f1797f08f90948d7599ec60a476f896013f164a49b38eae10c6cf9), WTx(8c3c1033296b4c593560f40fd22929cbcc6f63c3ec20287829e9b52dea9a4ea2), WTx(77c7e46e402f94c4a03445479e727b67008e105f2c97d3120e8c2d2008b6c6c3)])
 <-- from id=11833825 (conn_type=1): Inv([WTx(5a7a949a920cf57eacd8ad38906a56ba6882188dda4ff9ea5660aad35adf1ef4), WTx(1acc1f2f3ec70c4ffd2181783bb2407e204be39b1017b5ae13d45b9b54a19e43), WTx(205bfe2dfbeb46c7d91963a13097ef49511ad2d71c3018fdbdebbff83d8caa2f), WTx(0cd27eb1f63d95c0ec82adf0090756aef0eb1b1e840634ec7a4f440919ab991c), WTx(a361125873bffb5d70636e50bac18bd71963821d05ba07d9d70c91e660779632), WTx(5de0156daa756bdcad84a93699972a6ecb451841f2404ad181bd540c87006756), WTx(f2c8df33b2ef2e15c6d239e05f651927b4108758d99bafb478e76b9f7827e19d)])
 --> to id=8444252 (conn_type=2): Inv([WTx(1e34d5e8d3e34ee7257363a34c877ea6031f0657574c78d6d1379485e1a8b533), WTx(68ae6c3279f1797f08f90948d7599ec60a476f896013f164a49b38eae10c6cf9), WTx(8c3c1033296b4c593560f40fd22929cbcc6f63c3ec20287829e9b52dea9a4ea2), WTx(77c7e46e402f94c4a03445479e727b67008e105f2c97d3120e8c2d2008b6c6c3)])
 <-- from id=11937172 (conn_type=1): Version(version=70016, services=3081, timestamp=1750942328, receiver=Address(timestamp=0, address=IPv4(XXX), port=8333, services=0), sender=Address(timestamp=0, address=IPv4(XXX), port=8333, services=0), nonce=0, user_agent=/bitcoinj:0.14.5/Bitcoin Wallet:5.40/, start_height=902650, relay=true)
 --> to id=11937172 (conn_type=1): Version(version=70016, services=3080, timestamp=1750942328, receiver=Address(timestamp=0, address=IPv4(XXX), port=62311, services=0), sender=Address(timestamp=0, address=IPv4(0.0.0.0), port=0, services=3080), nonce=redacted, user_agent=/Satoshi:28.00.0/, start_height=902811, relay=true)
 --> to id=11937172 (conn_type=1): wtxidrelay
 --> to id=11937172 (conn_type=1): sendaddrv2
 --> to id=11937172 (conn_type=1): verack
 <-- from id=11937172 (conn_type=1): verack
 --> to id=11937172 (conn_type=1): SendCompact(send_compact=false, version=2)
 --> to id=11937172 (conn_type=1): Ping(2927426282439637971)
metrics tool
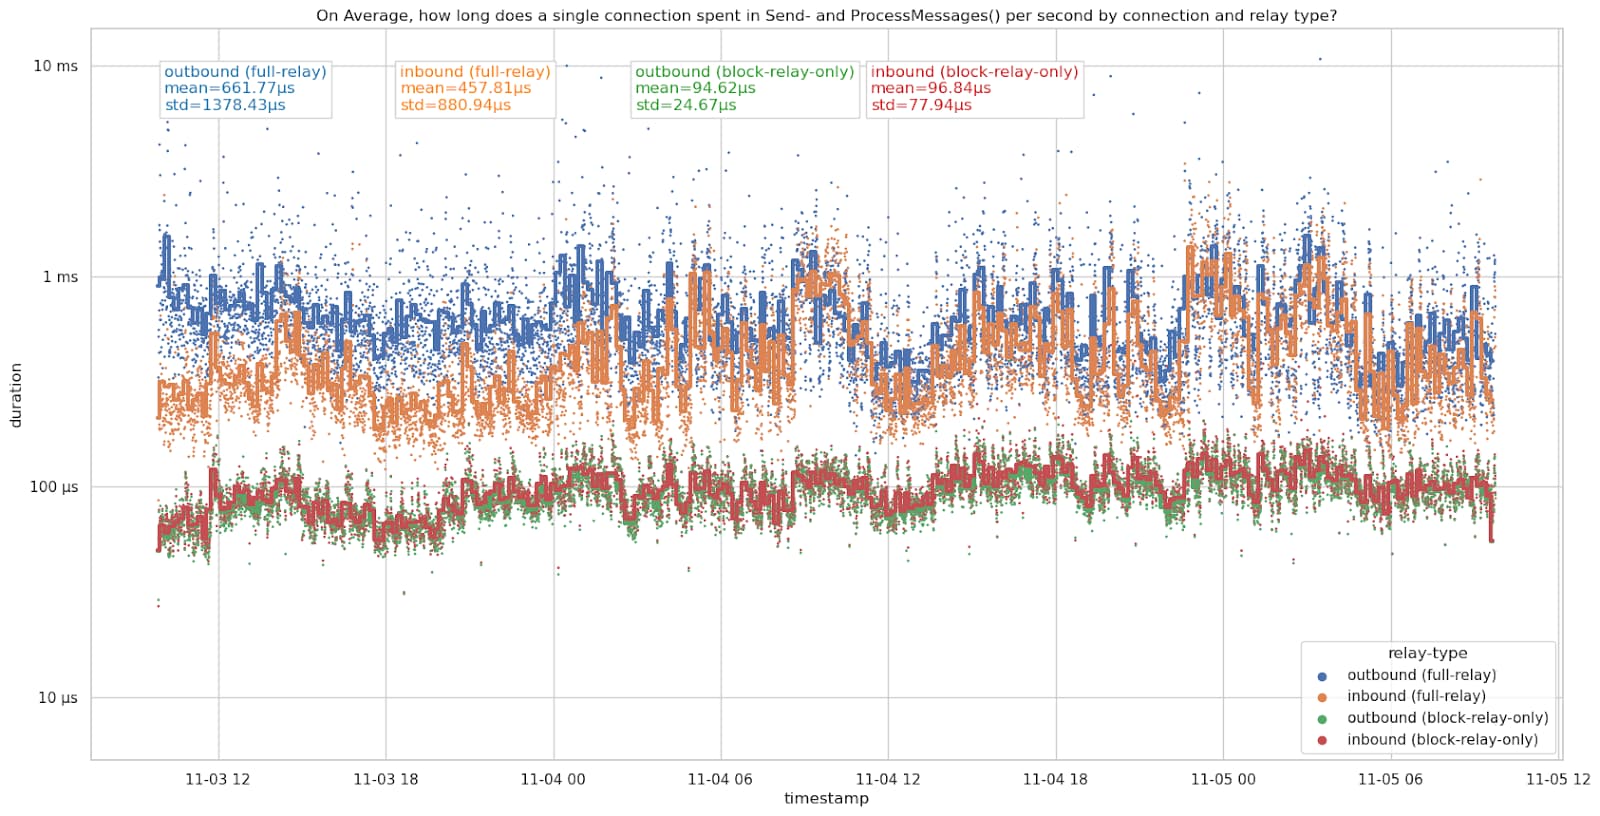
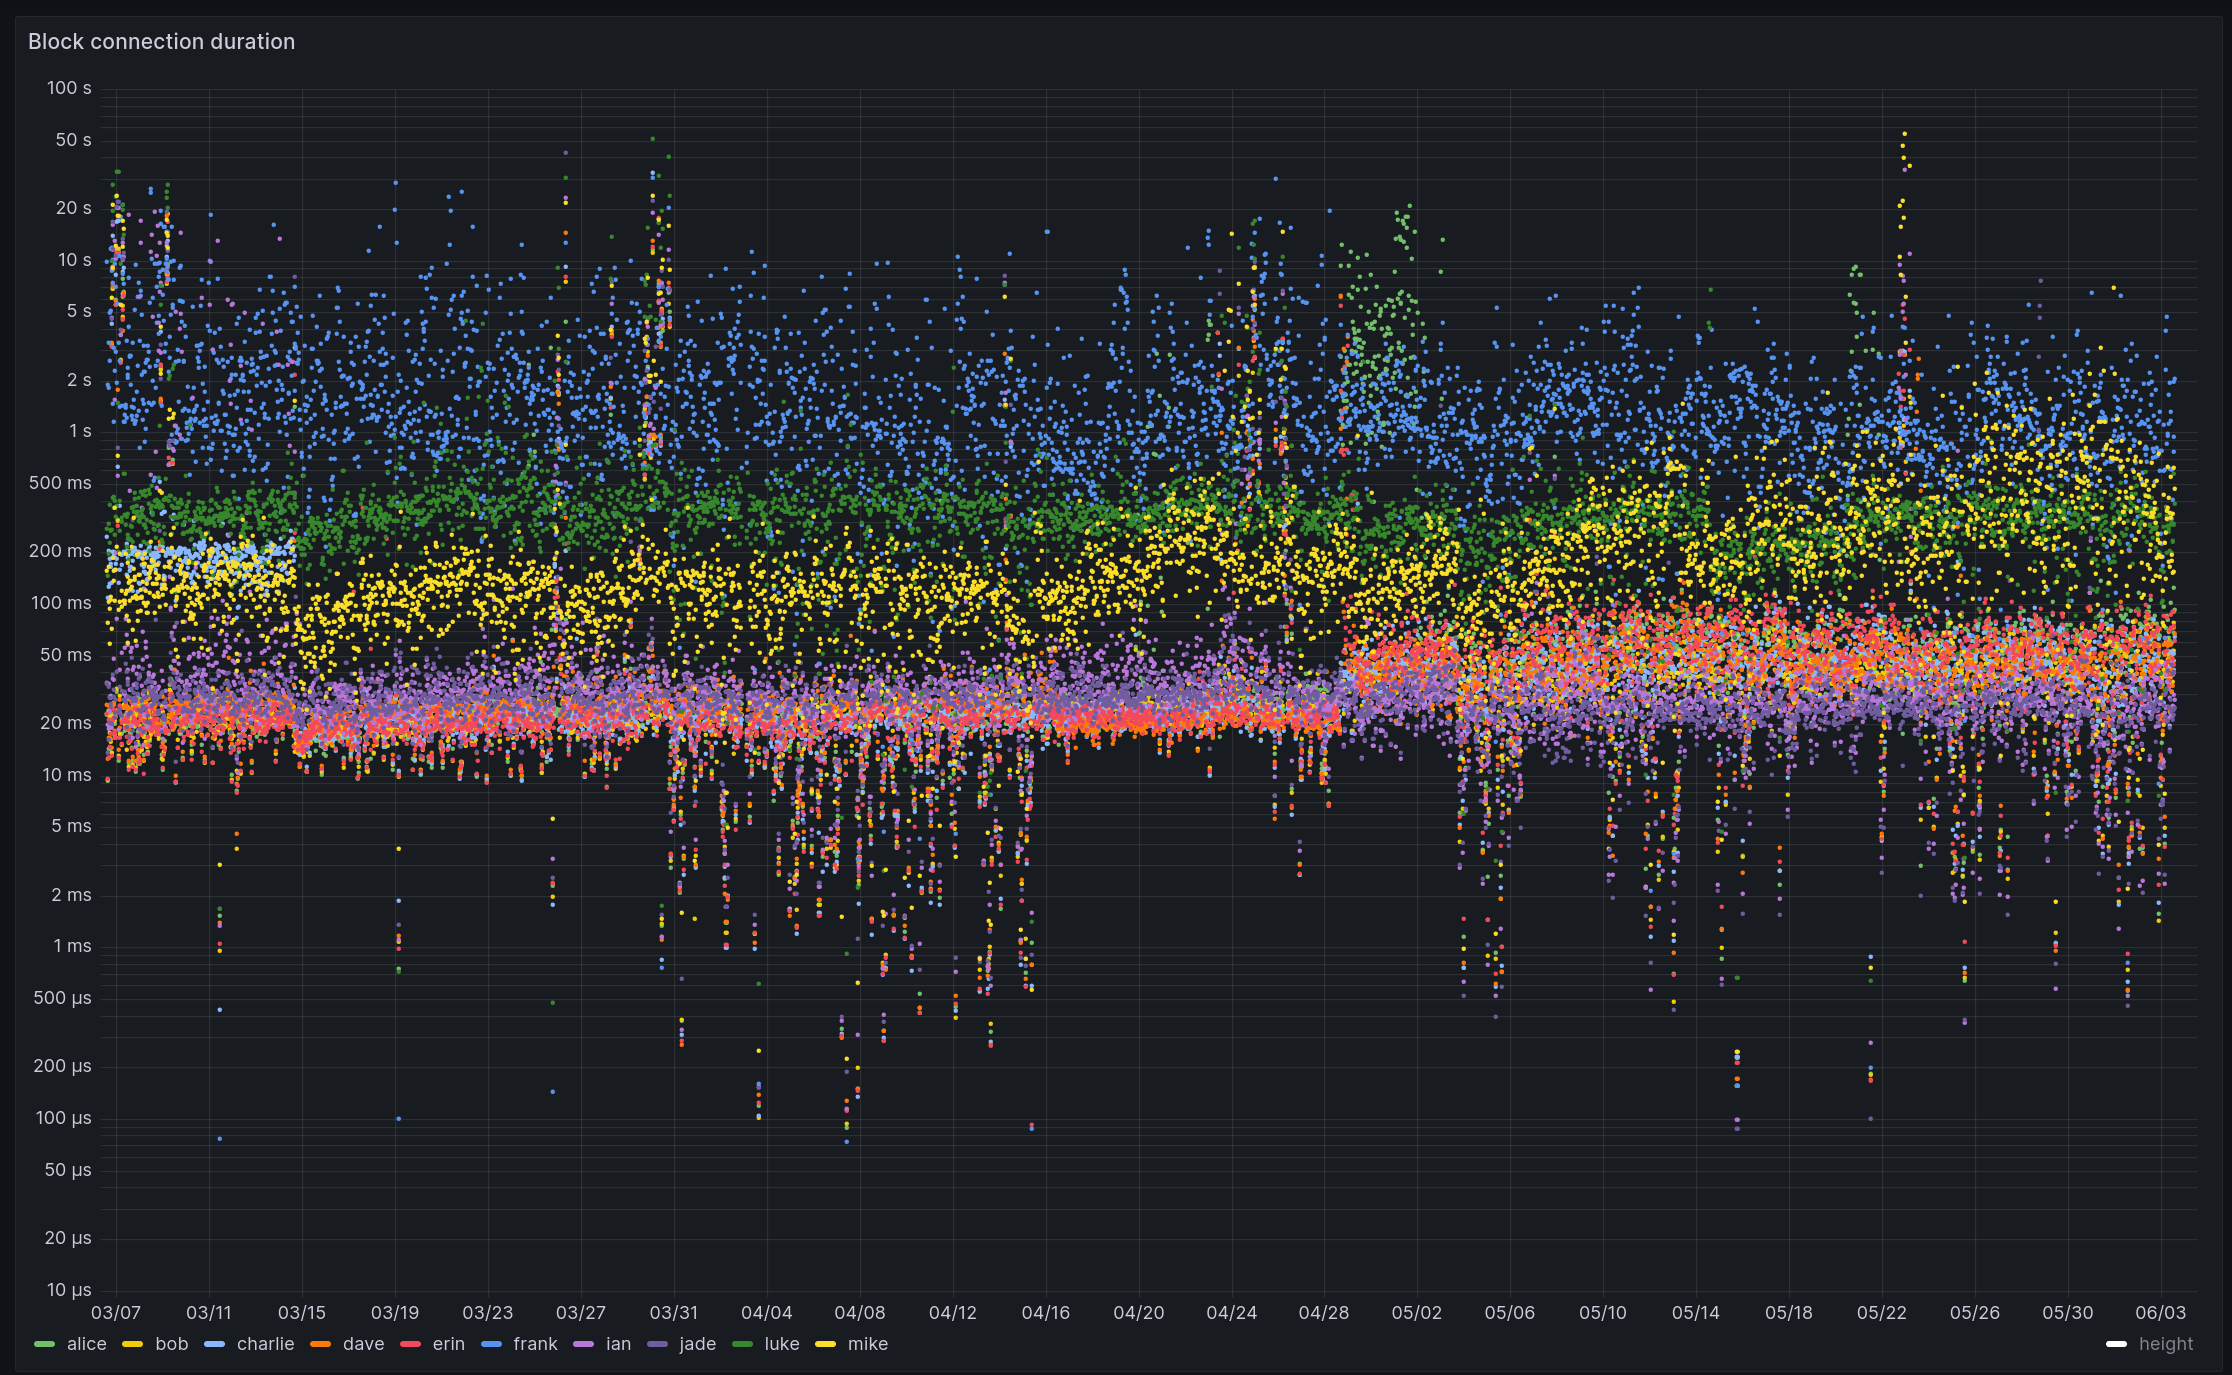
The metrics tool transforms individual events into aggregated statistics and serves them as Prometheus metrics. These metrics can then be displayed in Grafana dashboards. This allows for visual exploration and dashboard playlists that can help to detect attacks and anomalies visually. While there are some Grafana alerts for restarted nodes and inbound connections dropping, more work can be done on automatic anomaly detection. For this, the Prometheus recording rules mentioned in #13 (comment) could be useful to explore.
websocket tool
The websocket tool publishes the events from NATS into a websocket as JSON objects. This allows us to work with the events in a browser and enables building web tools and visualizations. An example is the p2p-circle.html page, which displays the node connected to peer-observer in the middle and arranges the node’s peers in a circle around it. Exchanged messages and opened and closed connections are shown.
The video shows the p2p-circle.html page with the peer-observer node in the middle and its peers arranged in a circle around it. The peers are labeled with their peer-id and colored by connection type: blue peers are inbound connections, red ones are full-relay-outbound, and yellow peers are block-only-outbound peers. Additionally, the P2P message exchange between the node and its peers, and new inbound connections being accepted and others being closed, can be seen.
The peer-observer infrastructure
As of writing, I host 12 honeypot nodes with different configurations across the globe as part of the peer-observer infrastructure. Running nodes with different configurations means having a bigger attack surface, and at the same time, being able to detect anomalies for more features. Some nodes run with privacy networks like Tor and I2P enabled. An attacker might perfer to attack via these to avoid leaving an IP address trail. Some nodes have bloom filters (known to be DoS-able, and observed in bitcoinj/bitcoinj #3404) and compact block filters enabled. Others run with a ban list to block, for example, connections from LinkingLion, and some are testing an ASMap file. Some nodes are pruned, others are not. Some accept an increased number of inbound connections, some don’t have a mempool and only process blocks, while others run behind a NAT and can only accept inbound connections from Tor, I2P, and CJDNS. A few nodes run binaries compiled with LLVM sanitizers (particularly ASan and UBSan) enabled. Most nodes run on x86_64, but I also have a few on aarch64. Generally, the nodes can run with different PRs, master versions, release candidates, or releases of Bitcoin Core. All nodes are configured with detailed debug.log logging enabled. As of writing, I have collected more than 35 TB4 of debug logs, which can be used in future research projects.
The MIT DCI generously sponsored six nodes between June 2023 and April 2025. I’m grateful for their trust and support in building out this project. Also, thanks to Sam, who has been very pleasant to work with. In April 2025, Brink took over sponsorship of these six nodes. The other six nodes are currently paid by me, as is the archival storage, web, and database servers. A public list of nodes can be found on public.peer.observer. Since the nodes are supposed to be honey pot nodes, I can’t share node IP addresses, hosting details, and data publicly. An attacker would know which nodes to ignore when attacking. I’ve been thinking about setting up a demo node with a public frontend and public IP address for people to explore and experiment with. However, I have had more urgent items in my backlog for now.
To manage and deploy nodes to different cloud providers and hardware with different node configurations and versions, NixOS has proven to be a useful tool. It allows me to write the infrastructure as code, track it in git, and have reproducible deployments across hosts. Without it, I don’t think maintaining the peer-observer infrastructure would have been possible as a one-man job. The Nix package and NixOS module for peer-observer are published in 0xb10c/nix, and I think I can publish a NixOS Flake for the node configuration at some point while maintaining my infrastructure in a separate, private Flake.
Next to peer-observer and Bitcoin Core nodes, the infrastructure also includes a fork-observer instance connected to the nodes (this is publicly accessible) and an installation of addrman-observer, which allows viewing the addrman of the nodes. Next to the metrics tool, each host runs a node_exporter that allows Prometheus to fetch metrics on CPU, RAM, disk, network, and more. Additionally, a process_exporter exports metrics on CPU time spent in each Bitcoin Core thread. Each host also runs a service that uploads the Bitcoin Core logs to a remote data share.
Some peer-observer findings
While building out the tooling and infrastructure, I already made a few observations of attacks and anomalies, and had the chance to use the node data for research into compact block relay efficiency. I’m linking to some write-ups below.
Early on, I discovered an entity I call LinkingLion, which opens multiple connections to Bitcoin nodes and listens to transaction announcements. The entity has been active since at least 2018 and is connecting to nodes on the Monero network, too. I assume the entity is a blockchain analysis company collecting data to improve its products. This is a privacy attack on Bitcoin users. Having access to data from multiple nodes makes it possible to detect attacks like these.
In May 2023, I noticed an anomaly in the number of inbound connections on one of my peer-observer nodes. Its inbound connections dropped, and the node had 100% CPU utilization. Looking into it, it turned out that an edge case in the Bitcoin Core transaction relay implementation had been triggered, and the node could not keep up with normal operation. Since many nodes in the network were affected by this, it had an effect on the whole network to the point where block and transaction relay were impacted. I’ve written down my notes from back then in this post. Having more monitoring and nodes back then would have helped to pinpoint and react to this anomaly faster.
One of my goals has always been to extract insights from data and feed them back into Bitcoin development. With detailed, historical logs from multiple nodes available, I published Stats on compact block reconstructions. This led to a renewed discussion on prefilling compact blocks to improve block relay. I hope to get back to finishing the implementation of this at some point.
There is a lot more data to process and monitoring to build out. I can’t monitor the Bitcoin network, analyze data, and build out tools alone. This could easily be a full-time effort for a small team of developers and data scientists. I’d be very happy to share data and help with processing, analyzing, and publishing findings. I’m also certain that finding funding for this work, given some prior Proof-of-Work, isn’t too hard at the moment.
A Bitcoin Network Operations Collective
As mentioned above, I noticed that I could use a few helping hands that are interested in monitoring the Bitcoin network health and analyzing data to provide data-based feedback for development. As of writing, Bitcoin has a market cap well over $2T USD. That’s more than Meta and Google, and close to Amazon. What monitoring infrastructure, Network Operation Centers, and incident response teams do these companies have to protect against attacks and anomalies? And what does Bitcoin have?
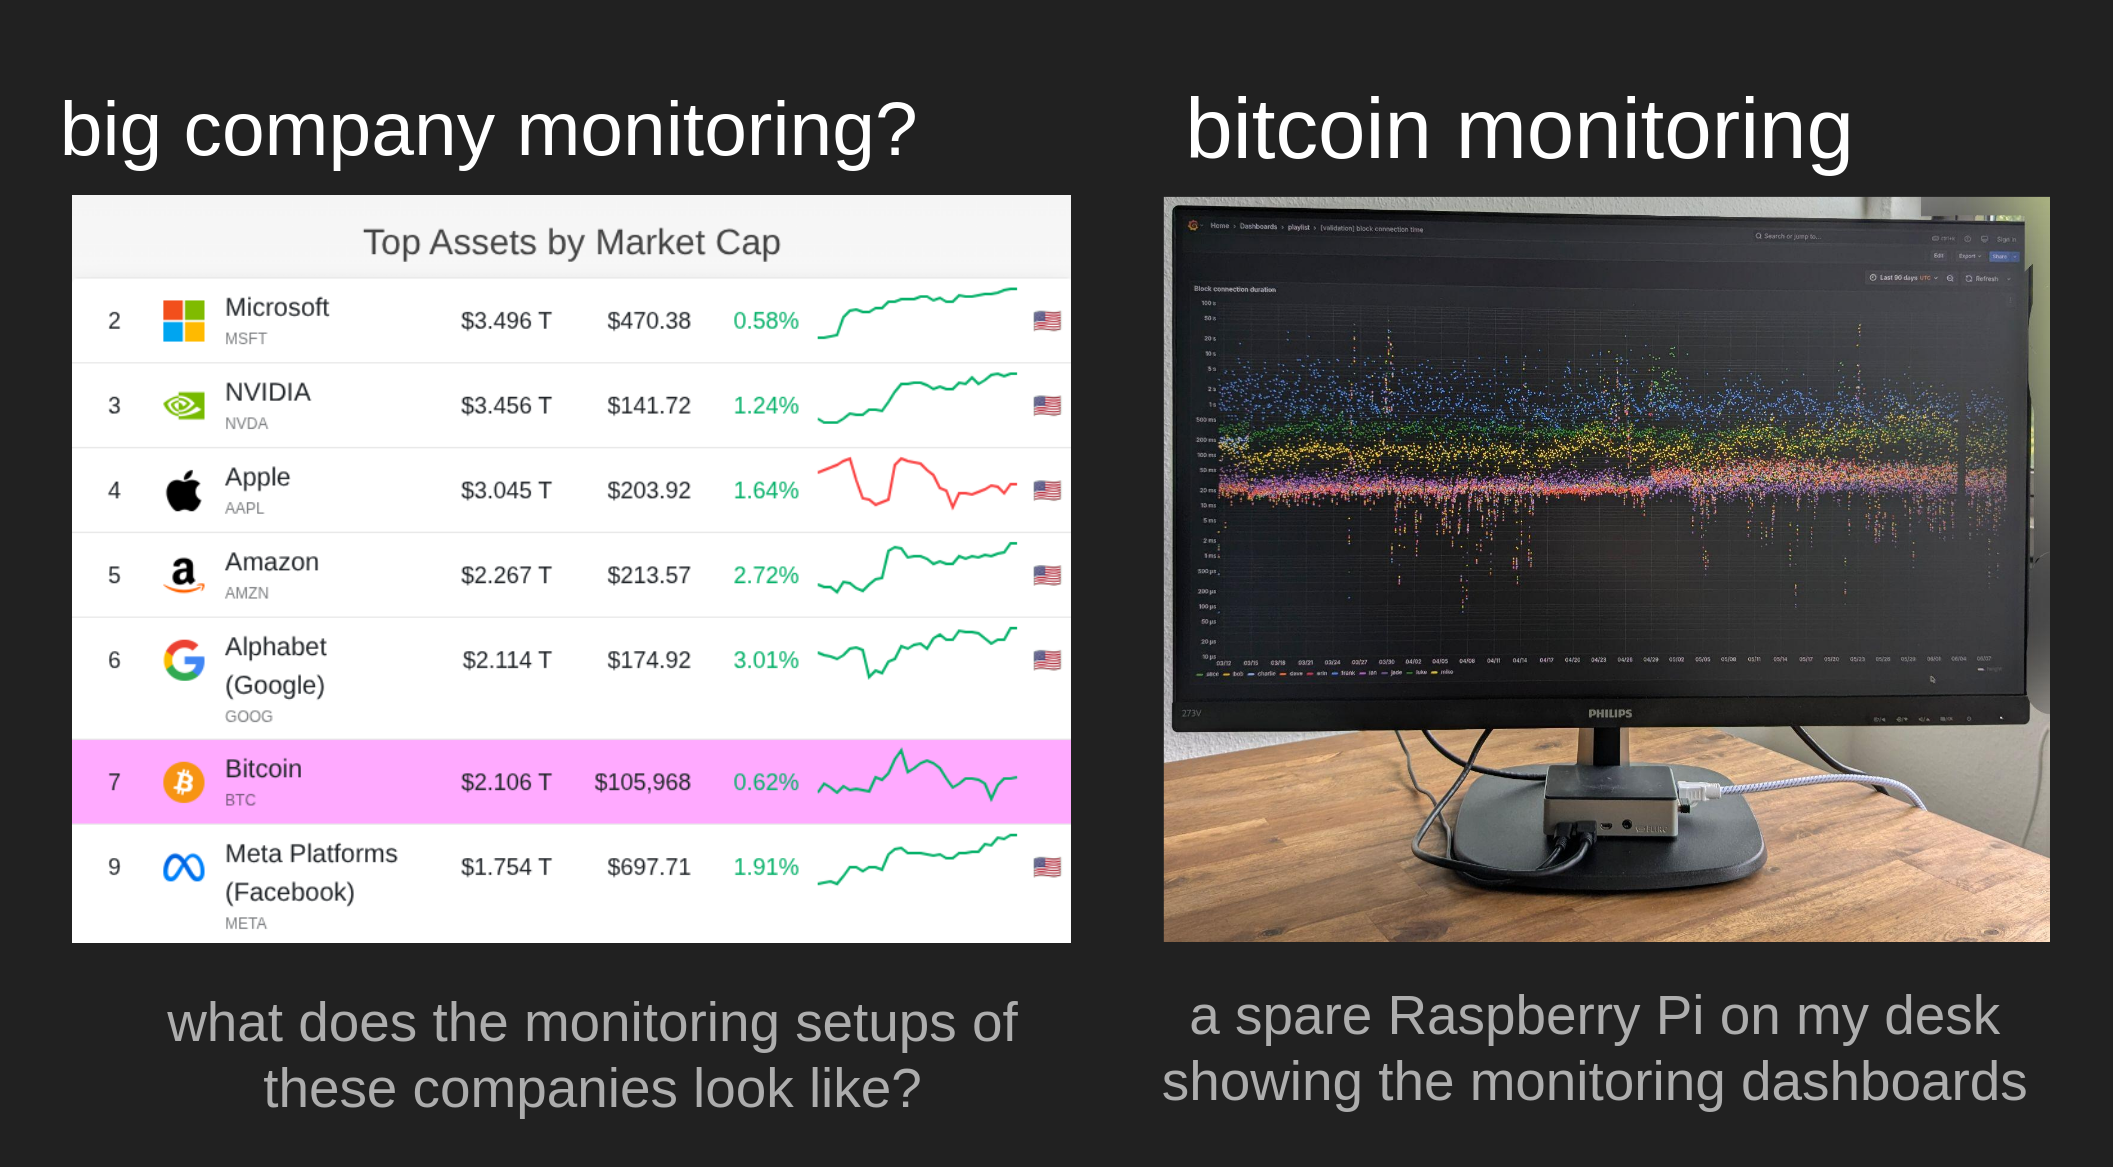
There are a few developers I know running nodes and looking at logs, the KIT DSN is running their Bitcoin Network Monitoring infrastructure, a Brazilian University is building out a Bitcoin Monitoring Lab, I heard, and Lopp’s statoshi.info is still running. And I have a spare Raspberry Pi on my desk that cycles through a few Grafana dashboards and might get a ping to my phone if on some node the connections drop faster than expected. What happens when I’m asleep, on vacation, or just don’t have the time to look into it?
With initial tooling and infrastructure in place, I’ve been thinking about the next step to improve the situation. If Bitcoin were a company, a Network Operations Center could be formed, and people could be hired for an incident response team. In Bitcoin, this works differently, and some might even reject a Network Operations Center as too centralizing. Similarly, people can’t be hired for a job like this. I think they need to be self-driven, curious about the behavior of network participants, and motivated to ensure the longevity of Bitcoin and its network.
What I’ve been thinking about might be better described as a Network Operations Collective. A loose, decentralized group of people who share the interest of monitoring the Bitcoin Network. A collective to enable sharing of ideas, discussion, data, tools, insights, and more. Maybe with a chat channel, a forum, a shared data store, and access to, for example, monitoring tools like my peer-observer. A place where a Bitcoin network incident could be analyzed, discussed, and ideally resolved, even if some members aren’t online. A collective with good relationships to developers, companies, and the community, to be able to reach out and be reachable if required.
I’m not sure if the time is right for this idea yet, and I’ll likely think about it for a bit longer. If you happen to have any input on this idea, want to support it, or want to get more into monitoring the Bitcoin network in some capacity, please reach out. If you don’t have an open communication channel with me yet, feel free to write an email to bitcoin-noc@(domain of my blog).

To avoid this problem, Bitcoin Core’s IP address manager (addrman) does not store all IP addresses it receives. It has a table with a fixed size and a DoS-resistant insertion and eviction policy. ↩︎
I don’t think the attacker tried to exploit CVE-2024-52919, but it remains unclear who the
addr-flooding attacker and what motivation for this attack was. ↩︎With the recent popularity of Bitcoin Knots, I’m considering adding a Bitcoin Knots node or two into my setup. However, since Knots and Core share most of the codebase, I don’t think there should be a lot of new insights to gain from observing a Knots node. Additionally, the main promise of the Knots patch set is the limited mempool policy, which ideally should make it less susceptible to e.g., mempool-based Denial-of-Service attacks. If you’re nonetheless interested in sponsoring a Knots node for my monitoring infrastructure, please feel free to reach out. ↩︎
Luckily, Bitcoin Core debug.logs compress fairly well, and I’ve been starting to combine and recompress them to save a bit of disk space. ↩︎
My open-source work is currently funded by an OpenSats LTS grant. You can learn more about my funding and how to support my work on my funding page.
 Text and images on this page are licensed under the Creative Commons Attribution-ShareAlike 4.0 International License