Bitcoin Transaction Monitor
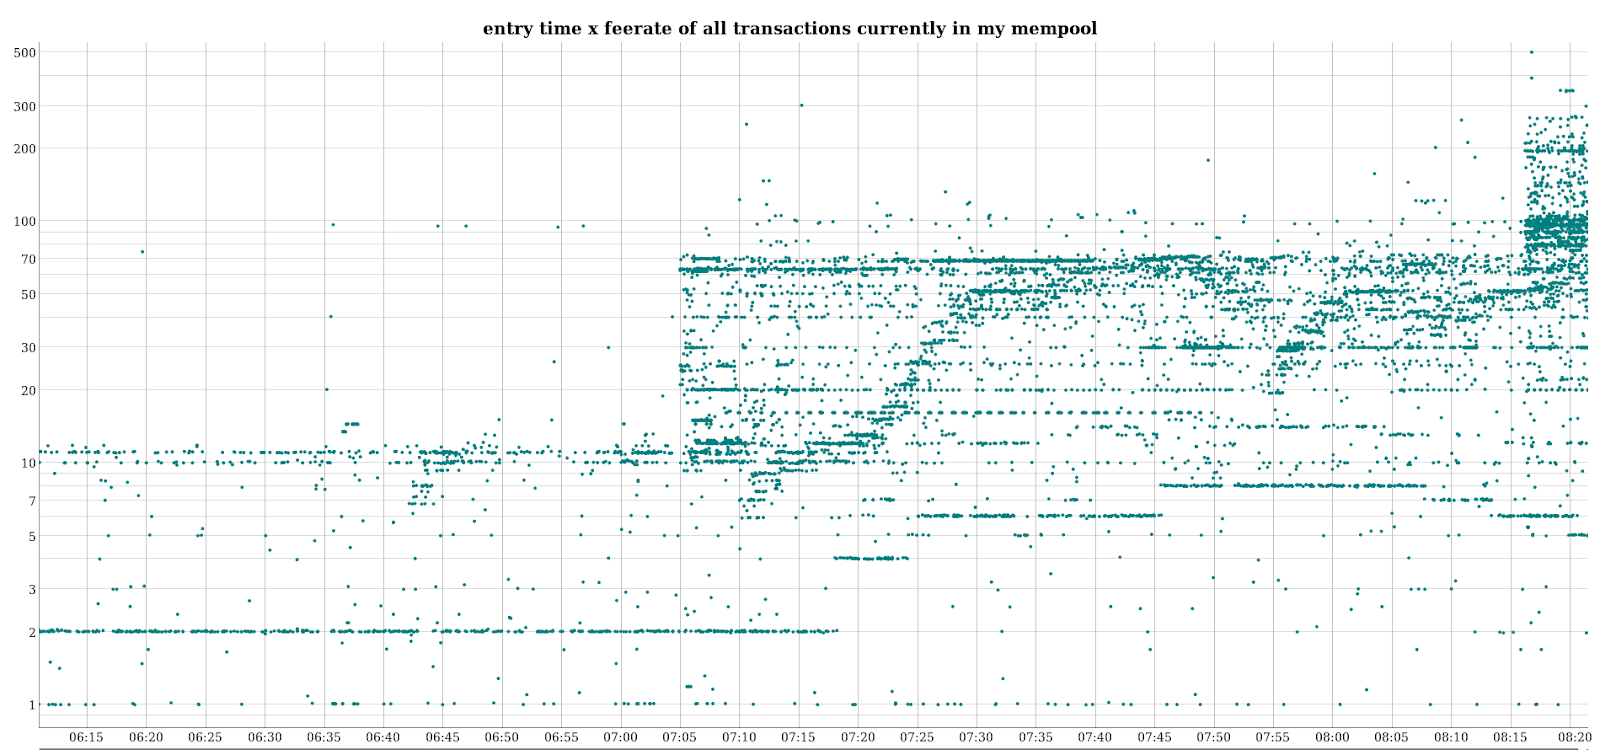
Thursday, October 10, 2019Whenever you, an exchange or somebody else sends a Bitcoin transaction, it gets broadcast to all nodes in the Bitcoin network. Each broadcast transaction is represented by a dot on the Bitcoin Transaction Monitor scatterplot. The transactions are arranged by the time of arrival at my Bitcoin node and its feerate (fee per size). The plot reveals activity patterns of wallets, exchanges, and users transacting on the Bitcoin network.
Building the Transaction Monitor
I first got the idea of plotting Bitcoin transactions by their arrival time and feerate as I was working on my mempool.observer project.
Plotting the output of Bitcoin Core’s getrawmempool RPC generated chart below.
While there are big white areas of confirmed transactions, there are definitely activity patterns visible.
This sparked my interest and I started to dive deeper.
My first goal was to find a way to efficiently extract the incoming transactions.
Polling the mempool via the getrawmempool RPC was not an option.
The RPC can run for multiple seconds if the mempool holds a few thousand transactions which is not too uncommon.
I started profiling the RPC but found no obvious way to speed it up.
Additionally, by polling, I would miss the confirmed transactions that entered the mempool between my last poll and a new block.
Bitcoin Core can be configured to publish transactions that enter the mempool via a ZMQ interface. These ZMQ messages contain the raw binary Bitcoin transaction. However, as I previously noted in my blog post Plotting the Bitcoin Feerate Distribution, Bitcoin transactions don’t contain the fee they pay as an explicit value. The fee is implicitly set by leaving a bit of the previous output amount to the miner when creating the new outputs. This means that I would have had to query the transaction fee for every transaction that arrived. As this would have made the project quite resource hungry I started thinking about my alternatives.
The best performing alternative I found was to patch my Bitcoin Core instance and to create a custom ZMQ publisher that sends the transaction and the fee. This approach allowed me to just subscribe to my newly added ZMQ publisher and be able to extract this data. The biggest downside here is probably that it meant that this creates a big hurdle for somebody wanting to self-host the Transaction Monitor.
The next step was to build a backend that keeps the last few thousand transactions and attach an API to it for retrieval in a frontend. I choose a Redis sorted-set and used the transaction arrival timestamp as score. This allowed me to quickly retrieve the most recent entries while being able to drop older transactions. I ended up implementing a 30-second cache and gzipped the JSON responses to speed up API calls even more. All in all, this allowed me to reduce the average response time to around 700ms (from more than 12s when starting off) and to respond to concurrent requests with nearly no increase in the response time.
For maximal flexibility, I choose D3.js to visualize the data in the frontend. D3.js comes with a steep learning curve but was the only library that allowed for the interactivity and performance I aimed for. At first, I tried to draw the dots for the transactions as objects in an SVG. However, this is slow with multiple thousand transactions drawn. The alternative was to use an HTML canvas that basically acts as a bitmap image. By using a Canvas the interactivity and the data-bindings that D3.js offers are lost. I ended up using a Quadtree (a tree data structure where each internal node has four children) to find transactions close to the user’s mouse pointer which enabled me to restore the interactivity while keeping the performance high.
I wanted to be able to filter transactions by their properties and thus I wrote a Golang library that allows me to answer questions about raw Bitcoin transactions. This library is called rawtx (project page).
The Bitcoin Transaction Monitor lets you now highlight transactions based on the block they are included in.https://t.co/q1sbHn4Tqy pic.twitter.com/hQcKvocg6O
— b10c (@0xB10C) January 15, 2020
Privacy Implications
I reflected a bit about the privacy implications before publishing the Transaction Monitor. For somebody familiar with the Bitcoin ecosystem, it’s companies, wallets, and users, it’s fairly trivial to attribute some transactions to entities using the Transaction Monitor. This was a point for not publishing it. However, I think there is a bigger total gain for the community in raising the awareness that the pseudonymity sets are small. Users and companies often leave distinct mempool-fingerprints. I’ve asked the following question in my Frequently Asked Questions: Bitcoin Transaction Monitor post as well:
Everything I display is public information. If I can build a Transaction Monitor in my free time that visualizes this data and could run on your laptop, what can a motivated bad actor do with far more resources?
Prior Art
- basil00’s TxMon, archived
- Conor Scott’s draw_mempool (master), screenshots
- Jan Vornberger’s bitcoinmonitor.com
How is the Bitcoin network being used?
— b10c (@0xB10C) October 10, 2019
I've build a Bitcoin Transaction Monitor to gain deeper insights on the Bitcoin network usage. Transactions are plotted by time and feerate, which reveals interesting activity patterns. https://t.co/CWgyPpdjJo
This is a neat new visualization of recent bitcoin transactions that makes it abundantly clear that some services are still hard coding their fee rates - there are no known fee estimators that recommended over 60 satoshis / vbyte during this period. https://t.co/VKJ2ivg6xE pic.twitter.com/0MoYtWkvco
— Jameson Lopp (@lopp) October 10, 2019
My open-source work is currently funded by an OpenSats LTS grant. You can learn more about my funding and how to support my work on my funding page.
 Text and images on this page are licensed under the Creative Commons Attribution-ShareAlike 4.0 International License